Sorting Through the Data
The FARMWISE Team uses data collected and analyzed to inform how we perform outreach and work with partners. What can feel tedious to some is actually quite informative and points to ways we can do more, grow networks, and help build capacity.
Sorting Through the Data
Recently Value Chain Professionals Greg Koehler and Audrey Kaul shared a bit of their insight to projects related to organizational and purchasing data.
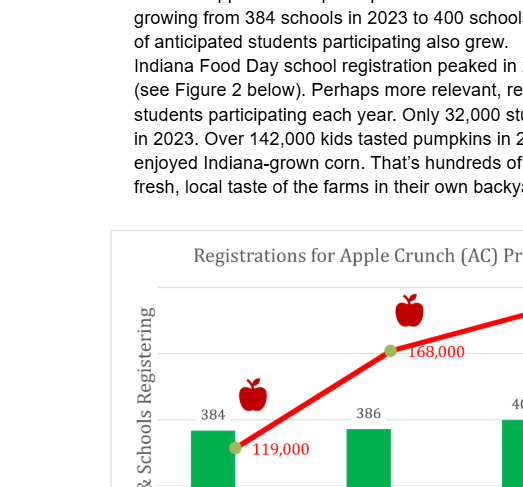
I started with 3 years of data for the registrations of two farm to school programs - Indiana Apple Crunch and Indiana Food Day. Each year was slightly different (collected differently, with different formatting and layout), so I needed to make sure the data tables were standardized year over year and then connect it to the K-12 lists of schools and districts FARMWISE already had. Using pivot tables and charts in Excel, I looked for trends in registrations over time as well as trends in repeat registrations. I looked for relationships between registrations and school district enrollment size, school district annual food expenditures, and whether schools had a food service company or a self-operated kitchen. Expenditures and type of kitchen did not lead to useful information for the purpose of the data briefs we are writing - because of some uncertainty of that data.
Greg Koehler
Learning About Indiana Populations
Recently I have been sorting through data and writing informational issue briefs we can use in a variety of ways as we engage with stakeholders in the future. Much of this research had quite a few touchpoints with the USDA Agriculture Census data, which goes to show how important it is that the USDA does that work.
Feeding America's dataset and Map the Meal Gap is also an incredibly valuable resource for this work. Both of these data sets are available for public use. On the topics that I already have a background in, like produce and food insecurity, I found it most difficult to pare the information down into a two-page brief.
Alternatively, produce auctions, nuts, and bees/honey are topics that I don't have a lot of experience in and have recently been learning quite a bit about. Since produce auctions are usually led by Amish and Mennonite communities, I have been looking through the US Religion Census and the Amish Studies database at Elizabethtown College.
The way in which the researchers estimated Amish and Mennonite numbers is fascinating, and I was surprised to learn that Indiana has the third largest population of Amish residents in the US. The Elkhart/LaGrange County area, Adams County area, Nappanee settlement, Daviess County area, and Allen County areas are all in the top twelve largest Amish settlements in the US.
The Elkhart/LaGrange settlement was established in 1841. Super interesting! Working on these briefs allows me to find interesting facts like these that I didn't know, even as someone who has worked in Indiana agriculture for a few years. Indiana agriculture is incredibly diverse and expansive!
Audrey Kaul